Qualysense
Grain Inspection Dashboard
UI/UX
Agricultural Technology
Client
Role
Industry
Qualysense
UI/UX Designer
Agricultural technology
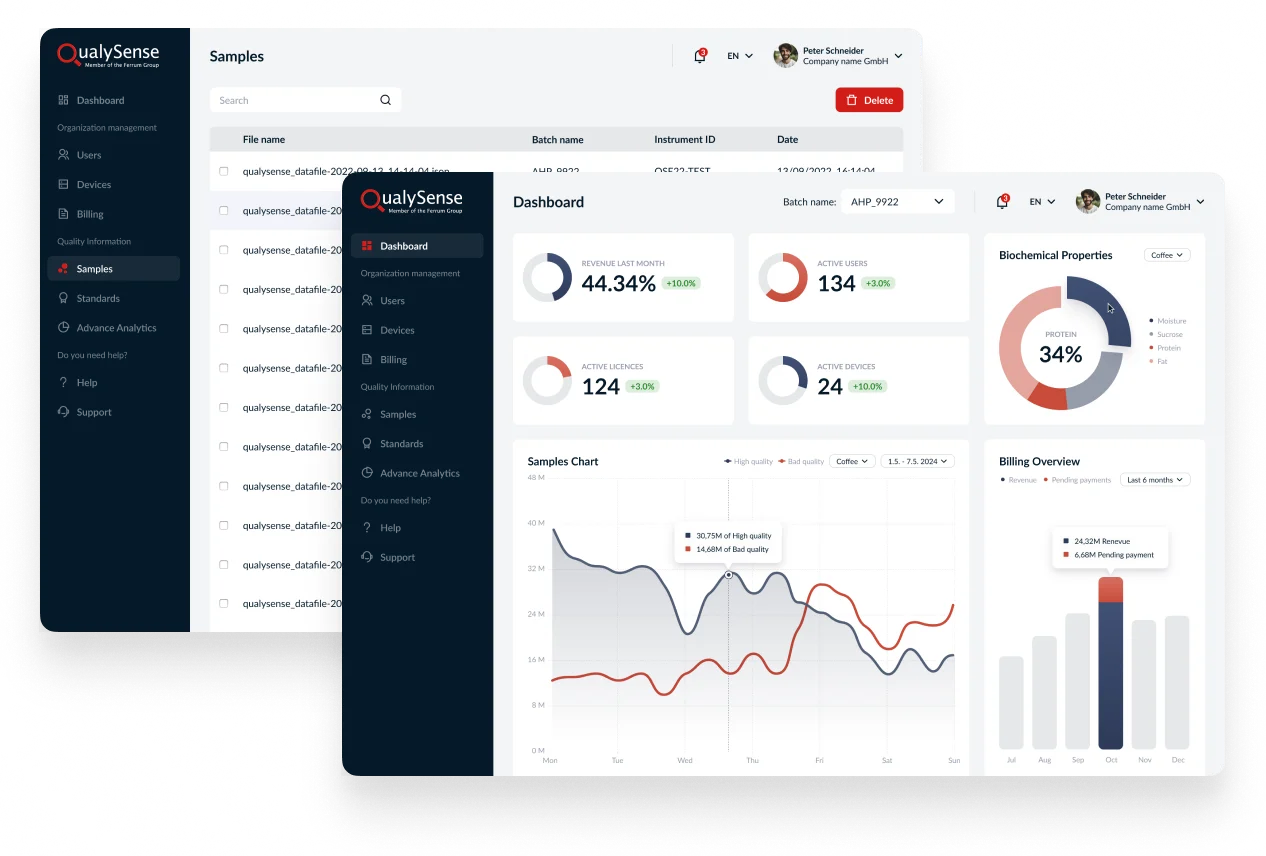
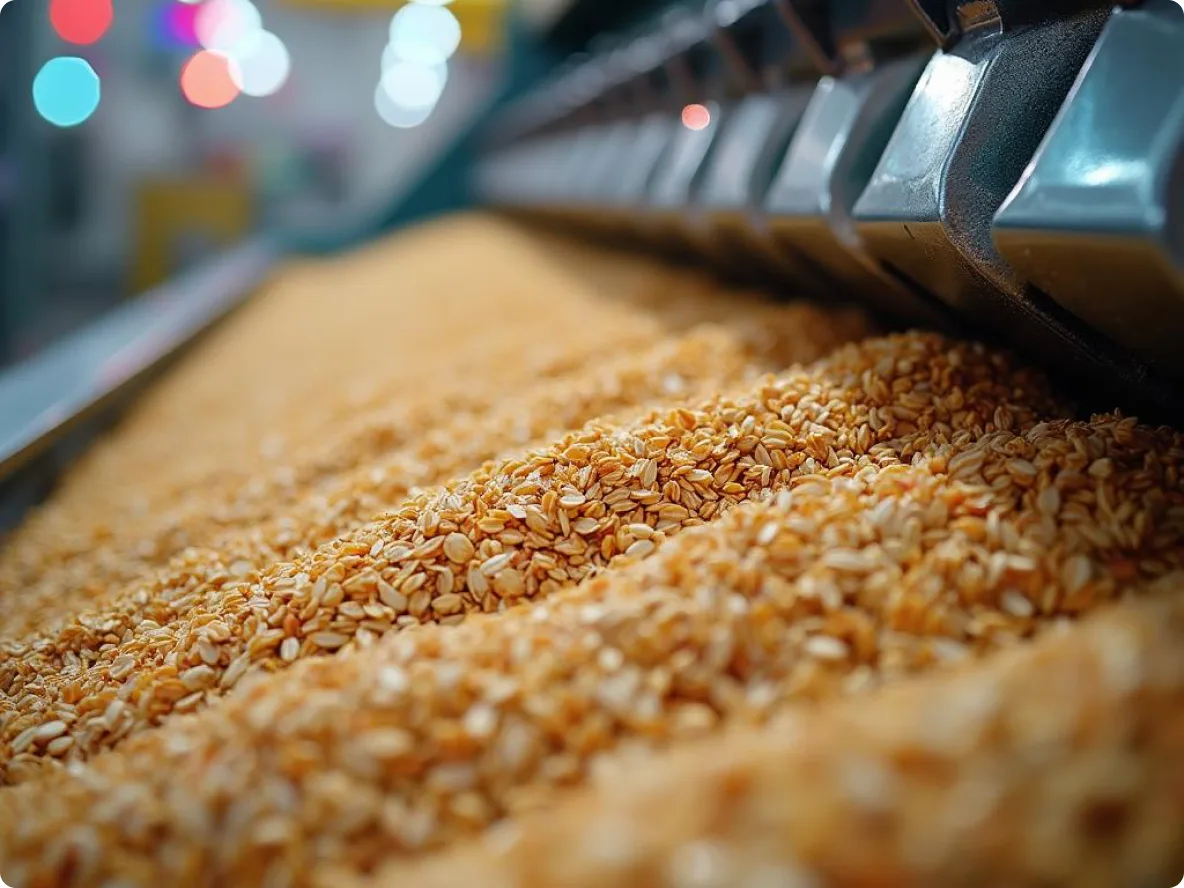
Qualysense specializes in high-precision grain and seed inspection. Their cutting-edge technology is revolutionizing the way grains are sorted based on quality parameters. Dashboard application designed to streamline and enhance the process of grain inspection by providing real-time insights and actionable data.
Results and outcomes
- The new design of dashboard reduced grain inspection times by 30%, allowing more inspections per day with improved accuracy.
- Lab technicians and operators praised its ease of use, reducing training time by 55% due to the intuitive interface.
Problem statement
The goal of this project was to design a comprehensive and user-centric dashboard that integrates seamlessly with Qualysense’s grain sorting machines, offering real-time insights into grain quality parameters like protein content, moisture levels, and size distribution. The dashboard had to be robust, intuitive, and scalable, suitable for a wide range of grains and seeds, enabling better decision-making and reducing operational costs.
Goals
- Enhancing inspection accuracy and efficiency
- Improve usability for diverse user groups
My design process
For the Qualysense project, the UI/UX research workflow began with the Idea phase, where we identified the need for a dashboard that would streamline seeds inspection processes. In the Concept stage, I developed initial wireframes and user flows based on insights gathered from interviews with stakeholders. I focused on their pain points and requirements.
During the Design phase, I had with stakeholders to get feedback on desings and user flows, iterating on the design to ensure it met their needs and preferences. Finally, in the Handover phase, I focused on refining the final design and delivering an MVP that effectively integrated essential features ensuring a user-friendly experience that addressed the core needs of the stakeholders.

Ideation

Wireframe

Design


Feedback
Handover
Design process
Ideation
The project started with deep research into the grain inspection process, involving user interviews with agronomists, lab technicians, and quality inspectors. The primary goal was to understand their workflows, pain points, and requirements for an efficient dashboard. We identified key challenges, such as data complexity, real-time processing needs, and the necessity for customizable inspection settings. Based on these insights, we defined core features for the MVP, including real-time monitoring, data visualization, and automated alerts.
🌐 Navigation and Layout
Goals


Frustrations


📊 Sample Management
Goals


Frustrations


🛠 Support Access
Goals

Frustrations


👤 User Management
Goals


Frustrations

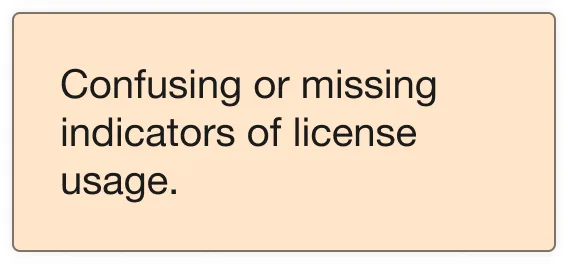

User flow for Managing Samples

User flow for Managing Users and Licenses

Design process
Wireframe
Once the key functionalities were outlined, I created low-fidelity wireframes to map out the user journey and dashboard layout. The focus was on structuring information clearly, ensuring that real-time data was easily accessible without overwhelming the user. I designed multiple layout variations, emphasizing usability and intuitive navigation. These wireframes were tested with stakeholders to validate the initial structure before moving forward to high-fidelity designs.

Design process
Design and feedback
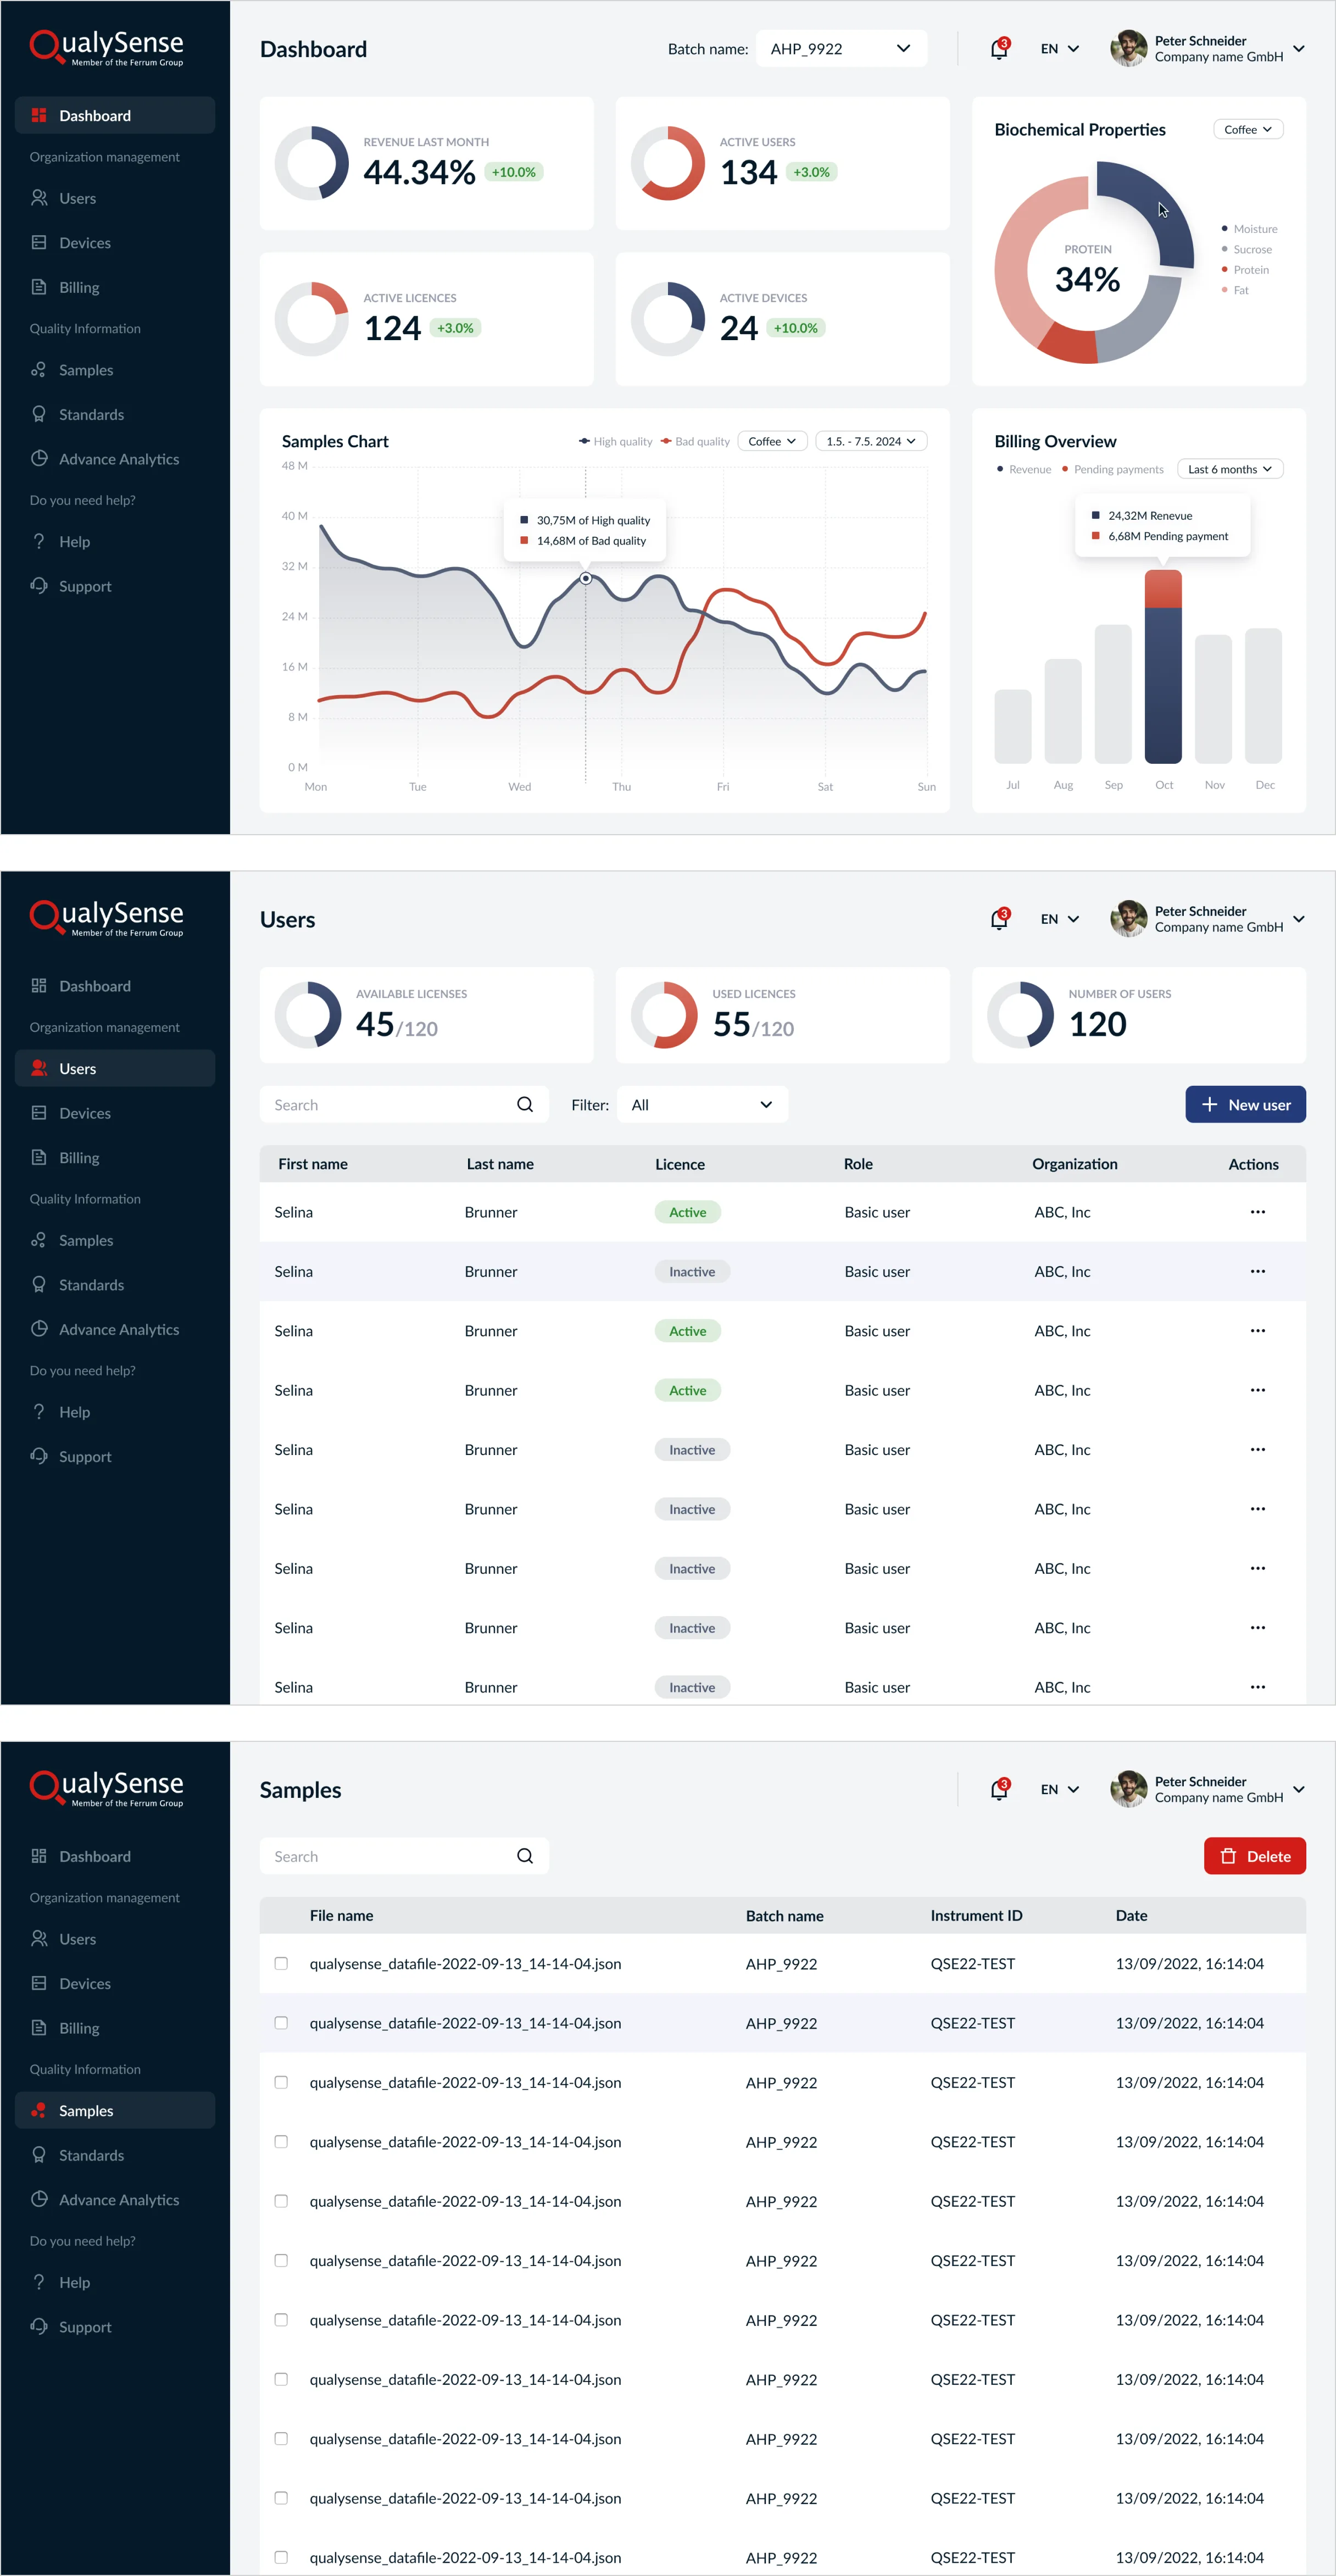
In the design phase, I created high-fidelity UI designs, ensuring a clean, data-driven interface tailored for industrial use. The dashboard featured color-coded indicators for grain quality metrics, interactive graphs for real-time monitoring, and modular sections for customizable inspection profiles. Emphasis was placed on clarity, accessibility, and responsiveness, making the system easy to use across desktop and tablets.
To refine the design, I conducted usability testing with real users, including grain inspectors and lab technicians. Feedback revealed the need for better data filtering options, improved visual hierarchy, and more intuitive alert notifications. Based on this input, I iterated on the design, enhancing navigation flow, readability, and responsiveness. The final adjustments ensured that both experienced technicians and non-technical users could efficiently interact with the dashboard.
Design process
Handover
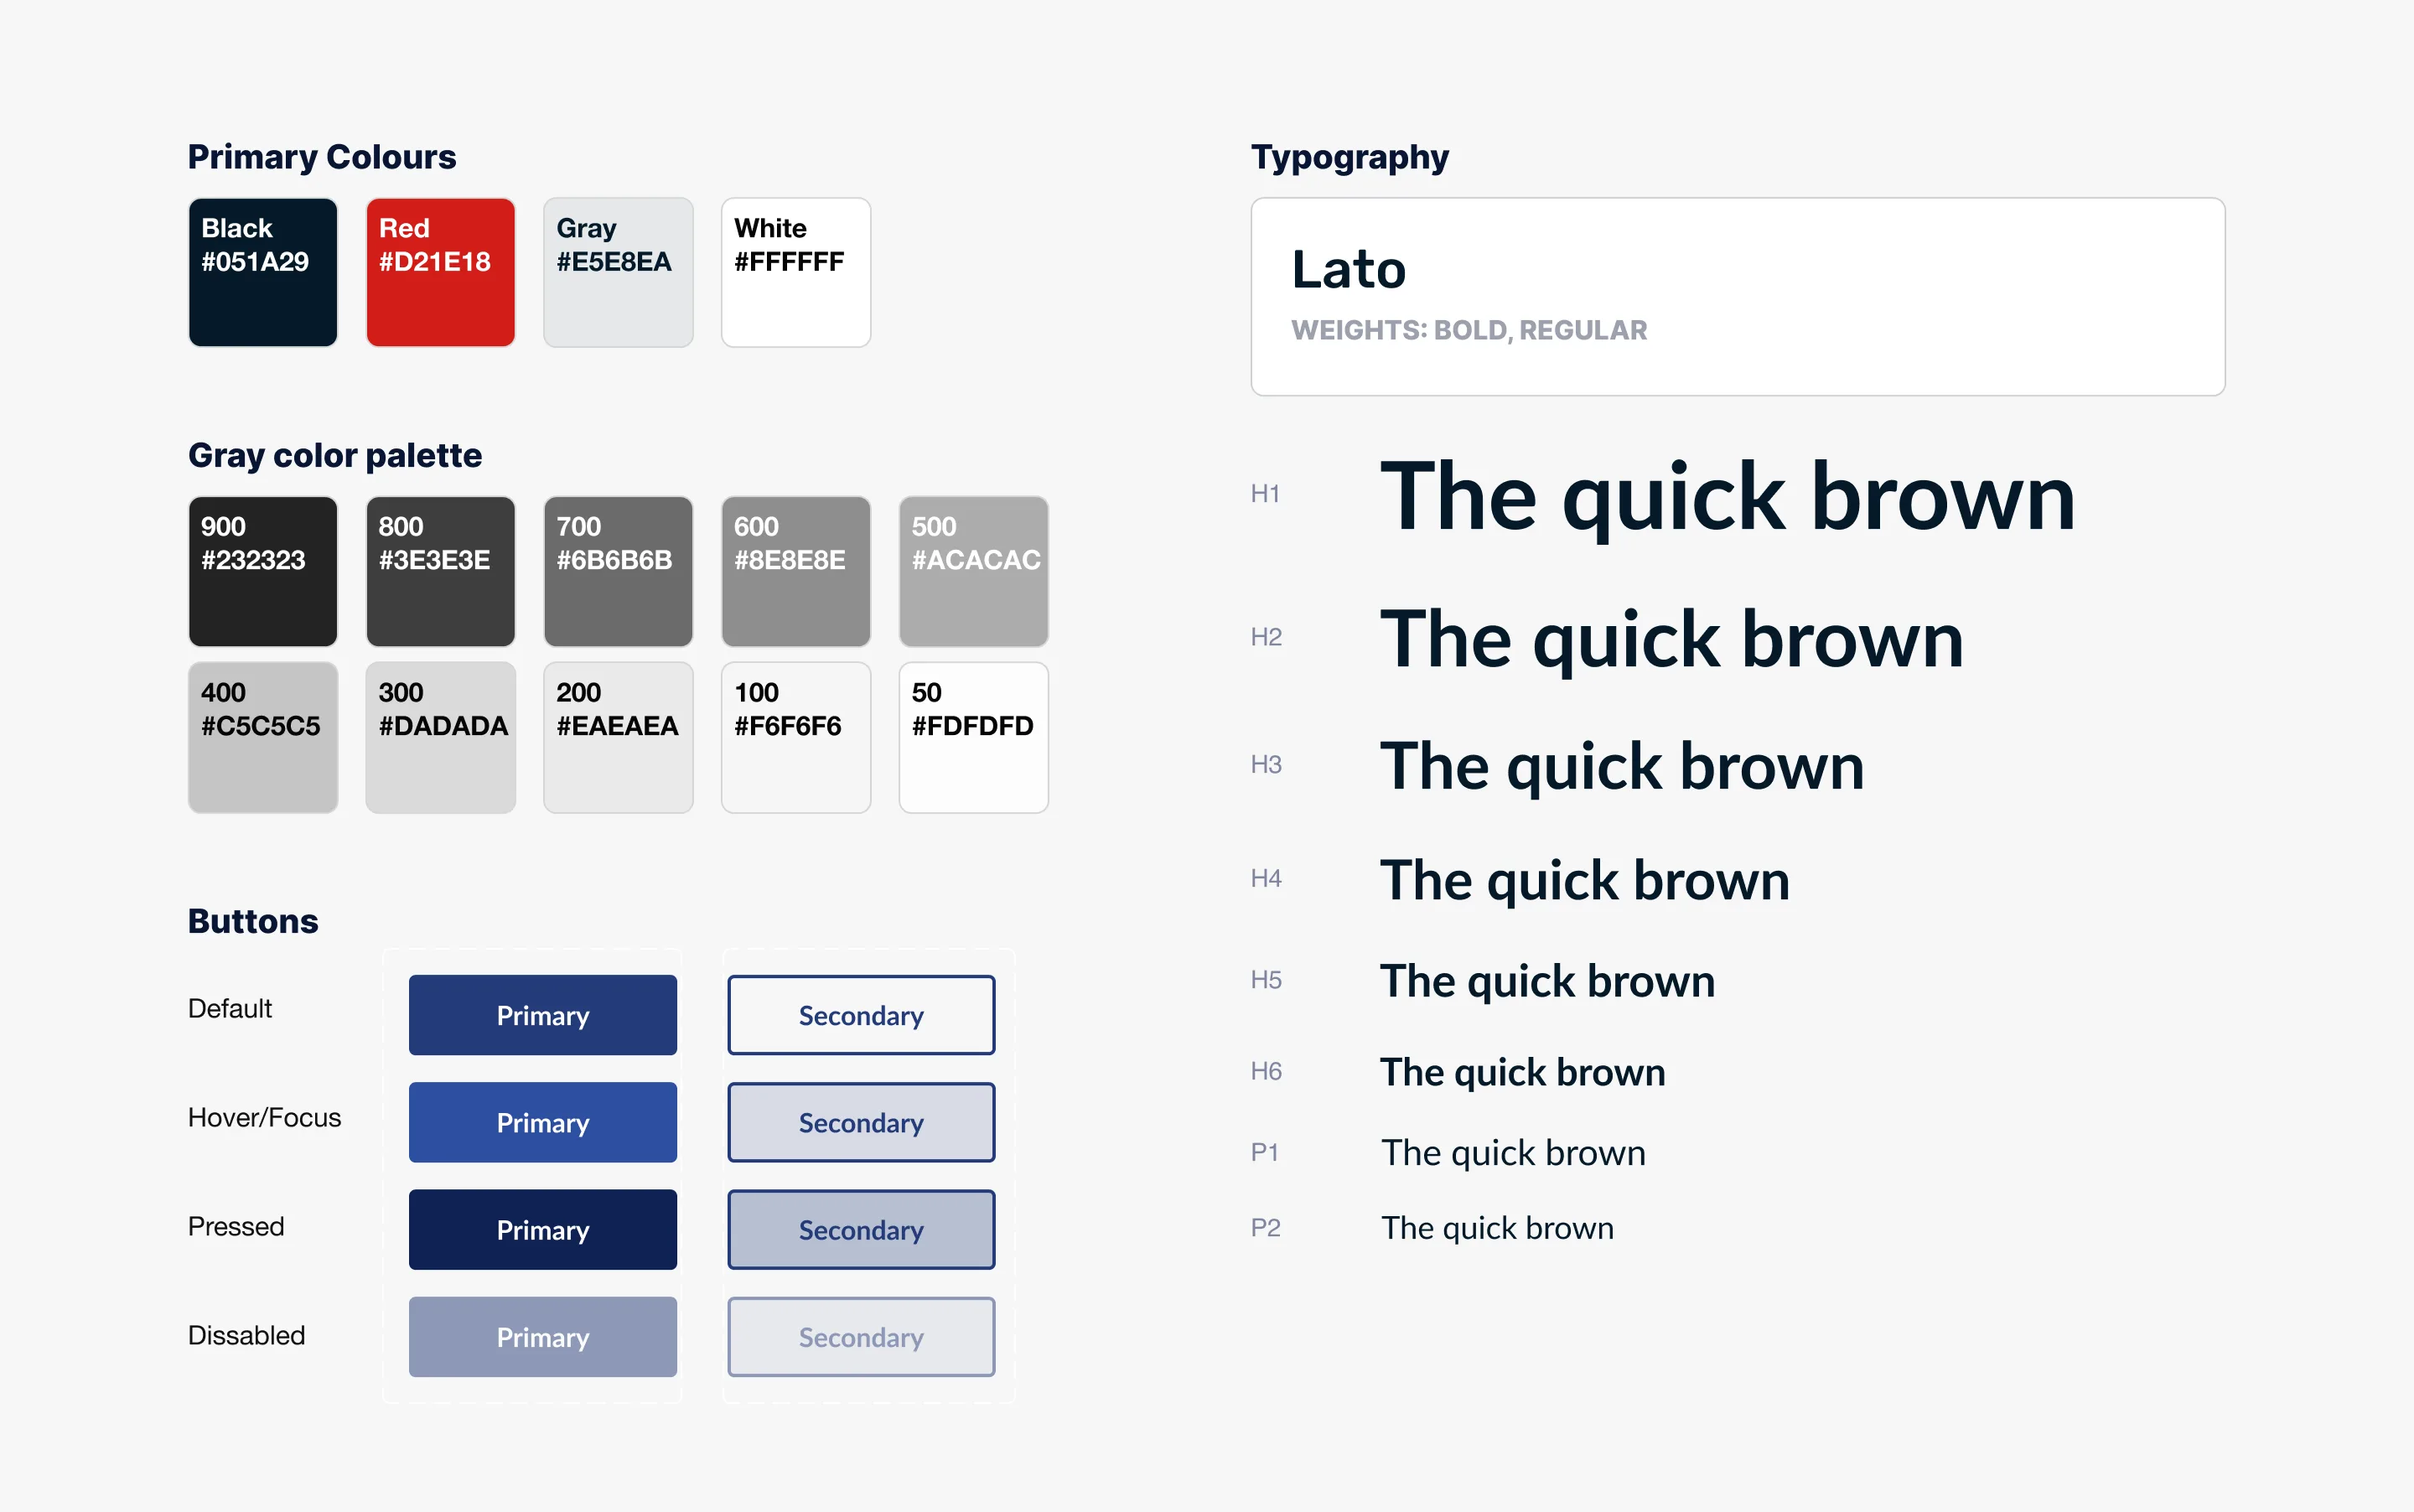
Once the MVP design was finalized, I prepared a style guide and worked closely with developers to ensure a seamless transition. Deliverables included Figma files, interaction guidelines, assets, and documentation on user flows and component behavior. Regular check-ins with the development team helped maintain design consistency, ensuring the final product aligned with the vision. The result was a scalable, intuitive dashboard that improved the grain inspection process, reducing errors and increasing operational efficiency.

Conclusion
The Qualysense Dashboard application has elevated grain inspection to a new level of precision and efficiency. By creating a solution that is customizable, data-driven, and user-friendly, Qualysense can ensure the highest quality standards for their grain and seed sorting processes. The success of this project demonstrates the power of thoughtful design and technological innovation in solving complex industry challenges.